Connect sources
Define data access, refresh and authoritative systems. Plan interfaces with error handling and retries.
CRM, ERP and business applications hold different pieces of information. We combine suitable data with Microsoft Fabric, define traceable metrics and build Power BI reports. Azure connects systems; Microsoft Foundry is added for a specific AI application.
Explore scope and workflow ↓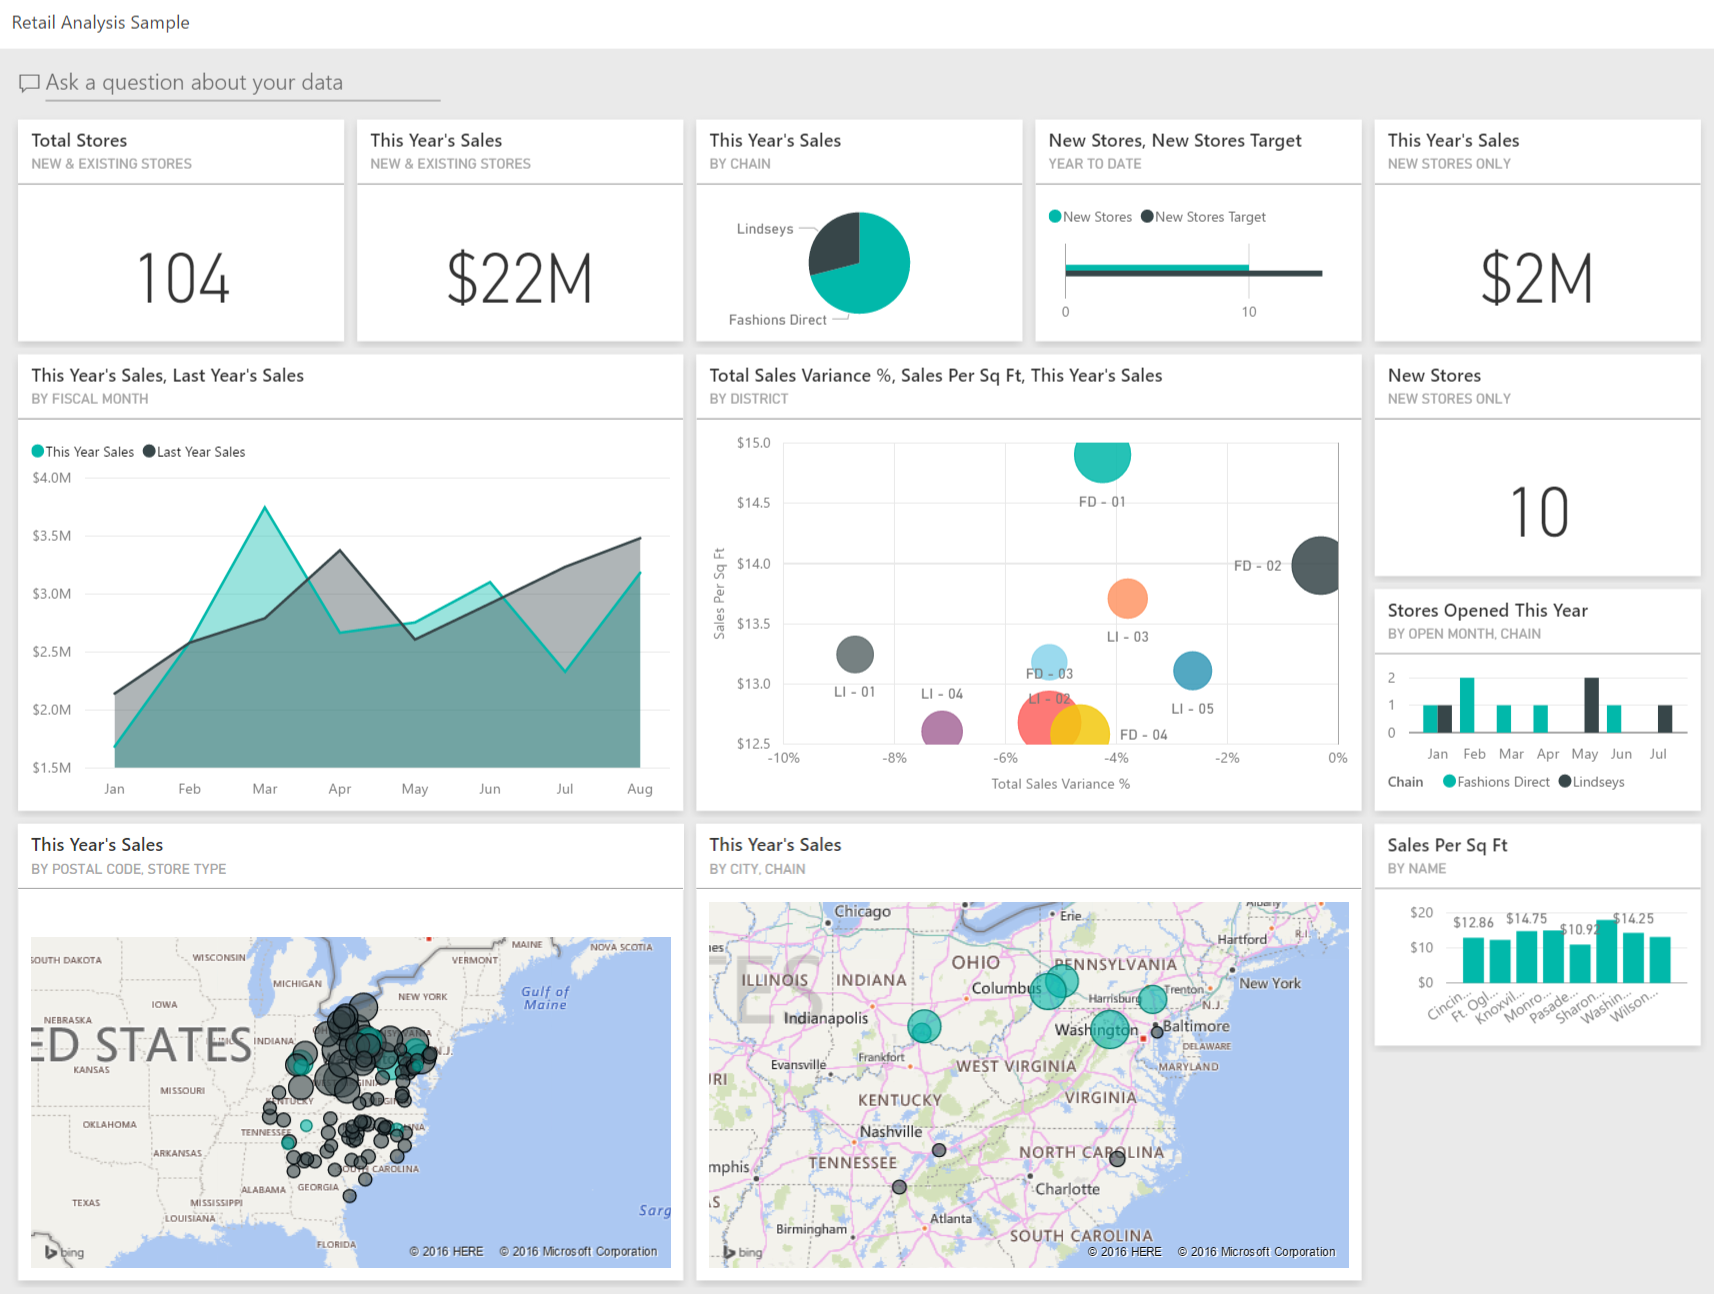 Enlarge image ↗
Define data access, refresh and authoritative systems. Plan interfaces with error handling and retries.
Fabric provides data processing and analytics; OneLake is the shared data store. We structure required domains instead of copying everything.
Organise ingestion and preparation in Fabric. Define scheduling, validation and error handling for each source.
Agree metrics and a shared semantic model. Reports must explain included data and how each figure is calculated.
Build APIs, events and workflows for CRM, ERP and business systems, including identities, retries and monitoring.
Develop and test models and agents for a defined task. Fabric handles data; Foundry is the development and operations platform for AI applications.
We define data ownership, metrics and refresh with your business teams. Microsoft Fabric connects and processes suitable sources and Power BI provides analysis. AI receives only the data permitted for its agreed task.
CRM and ERP report different figures. Monthly reconciliation ties up specialists before analysis even starts.
We agree customer matching, metrics and refresh timing. Fabric implements the data flows. A semantic model supplies shared definitions for Power BI reports.
Sales and management can trace the same figures and inspect source records when they differ. Recurring preparation can be automated.
Preparation hours per report, freshness, reconciliation effort and discrepancies between reports.
Order, service and production information arrives too late or as separate lists. Bottlenecks remain invisible until the next report.
We combine suitable process data, define status and timing and set the required refresh frequency. Reports expose outstanding work with a route back to the source.
Business teams identify outstanding work and causes earlier. Reporting stays connected to the real workflow and supports concrete decisions.
Time until a metric is available, manual reconciliation, data errors and recurring reporting effort.
Orders, inspection reports or delivery notes must be read, checked and handed over. Exceptions often end up in email or spreadsheets outside the actual process.
We digitise intake, data validation and approval. AI handles suitable extraction and classification. Exceptions remain visible and go to a named owner. Power Apps, the data platform and integrations implement the workflow.
The transaction is traceable without tracking it across several lists. Your business team handles exceptions instead of repeating the same re-entry for every document.
Time per document, corrections, unresolved exceptions and time to business approval.
We define data ownership, identities and transfer paths. Depending on the task, we use APIs, Azure Functions, Logic Apps or messaging. Duplicate events, timeouts and retries are tested. Monitoring shows successful records and where someone needs to intervene.
Each key metric has a definition, an owner and a traceable refresh state. Access is checked in the model and when sharing; an attractive report alone does not resolve conflicting figures.
Fabric, Power BI and Foundry have separate capacity and licensing models. A data platform does not automatically expose content to every agent. Access and business data quality are assessed separately.
Fabric Data Factory is part of Fabric. Azure Data Factory is a separate Azure service. Existing architecture, capabilities and operating needs determine the choice.
Yes. We assess connection options, permissions and environment prerequisites. Analytics access and operational write-back are separate concerns.
For a specific AI application, not simply a report. Model choice, tool access and quality tests matter once the task is defined.
We assess required metrics, sources and your existing Microsoft architecture.