Key figures everyone agrees on
We agree with the business and controlling how each key figure is calculated. After that nobody argues about the number, only about the result.
We build reports that sales, controlling and management actually use. First we agree what each key figure means and where it comes from. Then we build the data model, dashboards and AI-based forecasts, for example for the pipeline, year-to-date revenue or customer value.
Explore functions and applications ↓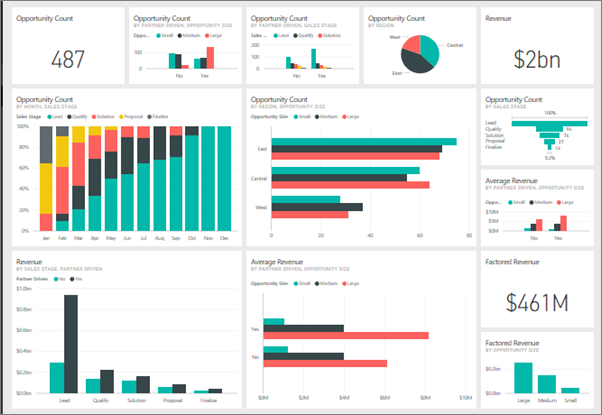
We agree with the business and controlling how each key figure is calculated. After that nobody argues about the number, only about the result.
Dynamics 365, SAP, hotel or laboratory systems supply the data. The model connects them through shared keys.
Forecasts for revenue, utilisation or demand, calculated with AI from history and visible in the report.
Everyone sees the figures they may see, down to row level.
Pipeline, year-to-date revenue and an AI-based forecast for every subsidiary in one report.
For a hotel group we show customer value, corporate clients, MICE and food and beverage across all properties.
Tickets, visits and device data show where service is needed and how quickly it arrives.
Figures from several systems for management, with clear definitions and updated automatically.
For a hotel group we bring together the information from the hotel systems. Dashboards show customer value, corporate clients, MICE and food and beverage, and AI-based forecasting supports sales and management.
More on hospitality →This explains the responsibilities. APIs, access and data ownership are agreed for your workflow.
delivered by NXTGNyour systems and teams
We plan licences and capacity according to how many people build reports and how many only read them.
Usually because each department calculates differently. We agree the definitions together and build one model for everyone.
Not always. For many reports Power BI with dataflows is enough. Fabric pays off when many sources, large data volumes or AI come into play.
A model learns from history, for example pipeline and revenue, and projects the next months. The report shows forecast and actuals side by side.
Discuss your workflow, existing systems, implementation and operational requirements with us.